Introduction
When I purchased my Fitbit, I was excited for all the information it would track. I looked forward to being able to analyze my sleep schedule, movement, and heart rate. However, when I went to download my data through the Fitbit website I saw that you can only retrieve 31 days of summary data combined into one spreadsheet.
I wanted more information.
Luckily, with a little extra effort you can use the Fitbit API to access raw data and import directly into R for analysis.
Part 1: Accessing Your Data
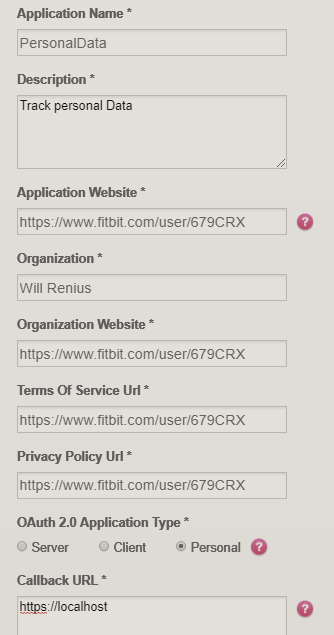
First, you’ll need an application. You can create one at dev.fitbit.com. Name the application whatever you want. If you don’t have a website for the application you can just use your Fitbit user account URL. Finally, for the callback URL use https://localhost. This URL is needed to get your authentication key. Make sure you click the option for personal application. Only personal applications have access to intraday heart rate.
Here is what my application looks like 
Once you have your application click ‘Manage My Apps’ and find your new application. Click the link that says ‘OAuth 2.0 tutorial page’ within the Application you registered.
Follow the directions on the Oauth tutorial. The first time you click the link provided you should get a page to allow access to Fitbit activity and heart rate, among other data categories. On later tries you may get a 404 not found page. That’s okay, the URL in the search bar will still work. Just copy paste it into the area specified within the tutorial page and find your Oauth 2.0 access token. Note that when it says copy everything after scope from the URL bar, you can just copy the entire URL.
That was the tricky part so hopefully you were able to find your code and can continue.
Part 2: Importing into R
Include the Libraries
First, open up R and include these libraries
library(httr)
library(jsonlite)
library(lubridate)
library(tidyverse)
Retrieving Heartrate Data
Now that we have our auth token we can query the API for heart rate. You can find all the different calls on the web API page here. I’m interested in the highest granularity data I can get, which is an average heart rate over every 5 second interval. You can find this API call in the intraday heart rate section.
Put your Oauth 2.0 access token here
auth.code = paste("Bearer", "[Your-Code-Here]")To call the Fitbit web API we’ll use the GET method from the httr library
#Get get intreday heartrate
query.response <- GET("https://api.fitbit.com/1/user/-/activities/heart/date/2018-01-05/1d/1sec.json",
                  add_headers(Authorization = auth.code)
                  )
#get the json response
json.heartrate <- content(query.response, "parsed")
Now to analyze the response we should convert the data into a dataframe.
heartrate.dataset <- json.heartrate$`activities-heart-intraday`$dataset
heartrate <- data.frame(
  matrix(
    unlist(heartrate.dataset),
    ncol=2, byrow=T),
  stringsAsFactors = FALSE)

#Clean response names
heartrate.formatted <- heartrate %>% rename(Time = X1, HR = X2) %>%
  mutate(Time = ymd_hms(paste("2018-01-05", Time)),
         HR = as.numeric(HR))
Part 3: View Your Heart Rate data
Here is what our formatted dataframe looks like
head(heartrate.formatted)## Time HR
## 1 2018-01-05 00:00:11 51
## 2 2018-01-05 00:00:16 52
## 3 2018-01-05 00:00:21 51
## 4 2018-01-05 00:00:26 50
## 5 2018-01-05 00:00:31 50
## 6 2018-01-05 00:00:36 50Now with one full day of heart rate we can graph it out
heartrate.formatted %>% ggplot(aes(x = Time, y = HR)) + geom_line()
Part 4: Getting the rest of your data
To get intraday heart rate by minute or second you can only query a single day at a time. Getting a single day is fairly straight forward once you have your access token. However, we are limited to 150 requests per hour, which means you can only ingest 150 days of heart rate data each hour. The following script will stop once you start receiving request limit errors. This script will wait an hour on failure and continue so you can run it over night.
getHeartrate <- function(auth.code, start.date, end.date, interval){
  start = as.Date(start.date)
  end = as.Date(end.date)
  if(!interval %in% c("min", "sec")){
    print("interval must be either 'min' or 'sec'")
    stop()
  }
  #create dataframe
  all.days = data.frame(Time = c(),HR = c())
  #loop through every day
  current.date = start
  while (current.date <= end)
  {
    query.response <- GET(paste0("https://api.fitbit.com/1/user/-/activities/heart/date/",
                                 format(current.date),
                                 "/1d/1",
                                 interval,
                                 ".json"),
                          add_headers(
                            Authorization = auth.code)
                          )
    #check for error
    if(query.response$status_code == 200){

      json.heartrate<- content(query.response, "parsed")

      new.day.dataset <- json.heartrate$`activities-heart-intraday`$dataset
      #
      if(is.null(new.day.dataset) || length(new.day.dataset) == 0){
        print(paste(
          "No data found on ",
          format(current.date),
          "skipping date and moving on"
        ))
        current.date <- current.date + 1
        next
      }
      new.day <- data.frame(matrix(unlist(new.day.dataset), ncol=2, byrow=T), stringsAsFactors = FALSE)

      new.day <- new.day %>% rename(Time = X1, HR = X2) %>%
    mutate(Time = ymd_hms(paste(format(current.date), Time)),
           HR = as.numeric(HR))

      all.days <- rbind(all.days, new.day)

      current.date <- current.date + 1
    }
    #we errored
    else{
      print(paste(
          "Error on ",
          format(current.date)
          ))
      #What was the error?
      print(query.response)
      #rate limit error?
      if(query.response$status_code == 429){
        print("Hit rate limit, waiting 1 hour")
        Sys.sleep(3600)
      }
      else{
        return(all.days)
        break
      }

    }

  }
  return(all.days)
}
Now to get all your data into a dataframe you just need to run this function.
final.heartrate <- getHeartrate(auth.code, "2017-12-22", "2017-12-26", "sec")Finally save all your data into an rds file so you don’t have to query the API next time.
saveRDS(final.heartrate, file = "../../RData/fitbit_heartrate_20180910.rds")Now that you have all your heart rate data in a tidy data frame you can combine it with other data sources and do whatever analysis you want!