I’ve been very interested in idle games recently. Idle games, clicker games, and incremental games all refer to games that allow continuous progression even while you are away. The main interaction is usually clicking one button for points and then compounding effects with various items. I find them particularly interesting because they have very simple optimization mechanics. Since they have pretty simple mechanics and layout, my girlfriend and I thought it would be fun to start building our own clicker game. To get an idea of how the numbers worked out I wanted to build a simulation of another popular idle game, Clicker Heroes.
In Clicker Heroes you can hire heroes to destroy monsters for you and get ever increasing amounts of gold for each monster you defeat. Then you hire more heroes to get more gold to hire more heroes and so on. Inspired by Anthony Pecorella’s post, The Math of Idle Games, I decided to build a simulation for some of the mechanics to view how they play out with optimal choices. I don’t plan on coding in every game mechanic of Clicker Heroes, but I’d like to get a glimpse of how these mechanics affect strategy. So in this first part of my Clicker Heroes analysis I’ll simulate the purchasing of heroes to help increase damage per second.
I’m going to be running an analysis in R so let’s go ahead and include some packages.
library(tidyverse)
library(matlib) #used for finding roots
source("clicker_heroes_sim.R")#all my code will be included here
Variables
The first step is to map out the variables at play in Clicker Heroes. Ultimately, the goal is to find how our purchases will impact gold accrual. Gold is retrieved from killing monsters so we’ll need to know their health.
Monster HP
Pmin is “parallelized min” and will min the zone and 140 even when passed as a vector of zones.
get_monster_hp <- function(zone){
  return(ceiling(10*(1.6^(pmin(zone,140)-1)+pmin(zone,140)-1)*(1.15^pmax(zone-140,0))))
}
monster_hp_df <- data.frame(health = get_monster_hp(1:10),
zone = 1:10)
monster_hp_df %>% ggplot(aes(x = zone, y = health)) +
geom_point() +
scale_y_log10()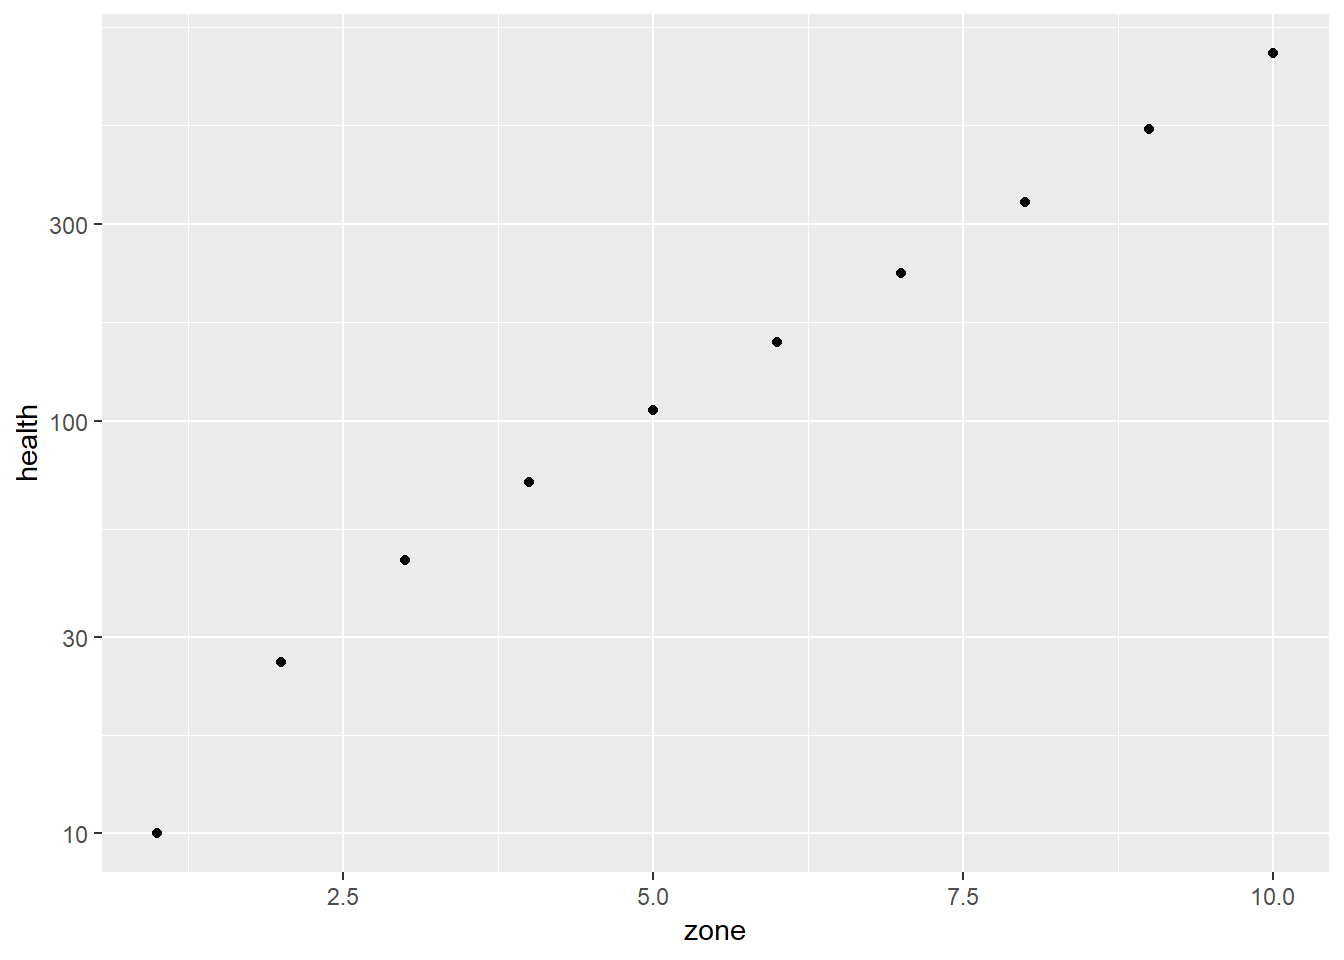
Monster Gold
Monsters with more health drop more gold. Here is the function for how health and monster zone convert into gold. This is ignoring multipliers, bosses, and treasure chest monsters.
get_monster_gold <- function(zone){
  ceiling(get_monster_hp(zone)/15*min(3,1.025^max(0,zone-75)))
}
monster_gold_df <- data.frame(gold = get_monster_gold(1:10),
zone = 1:10)
monster_gold_df %>% ggplot(aes(x = zone, y = gold)) +
geom_point() +
scale_y_log10()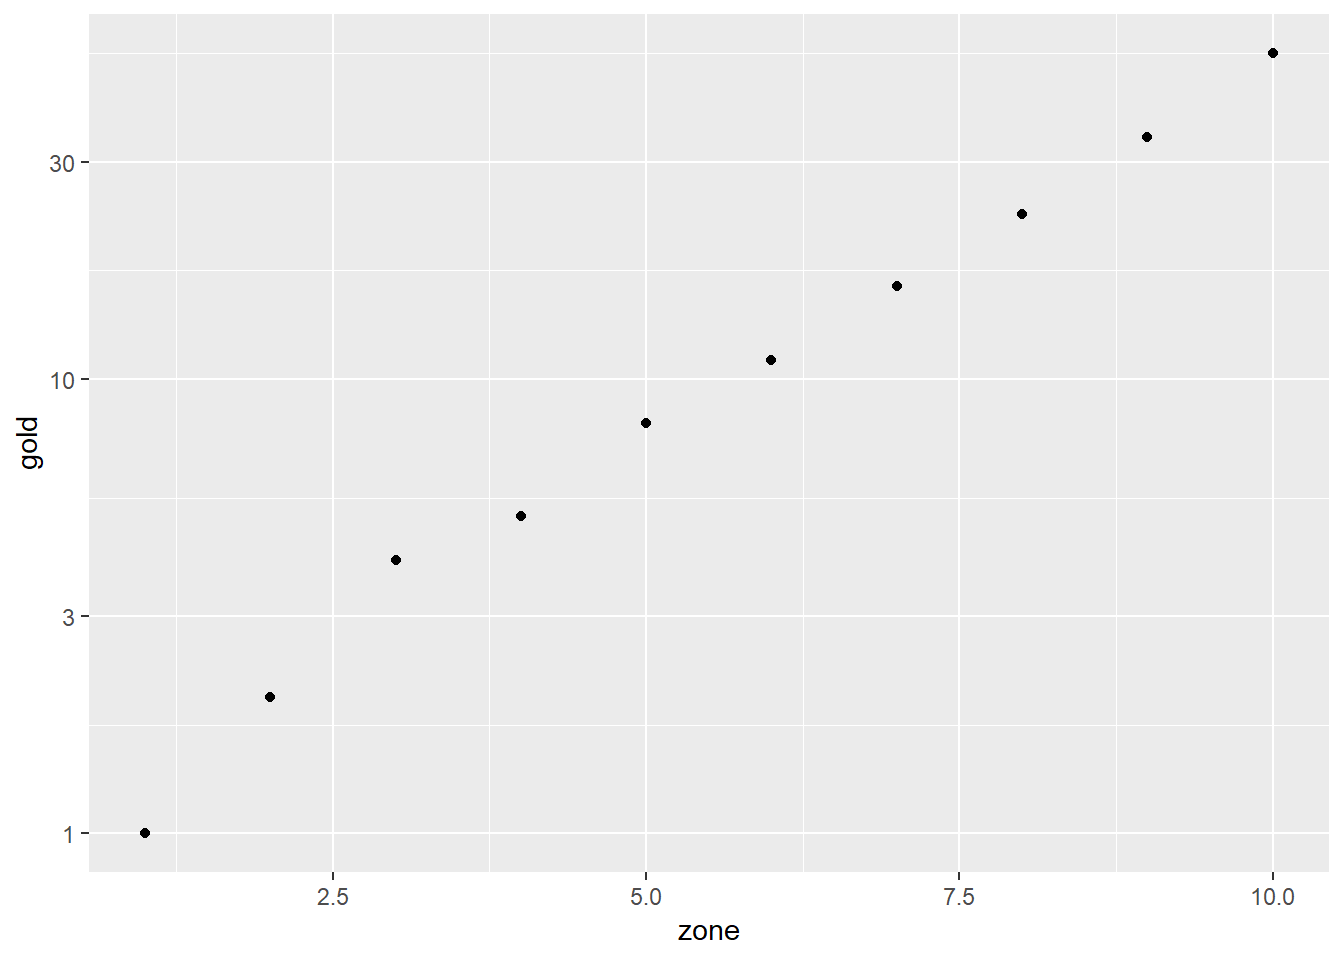
To get the gold we need to kill the monsters. That’s where heroes come into play. All heroes I’ll be adding in this iteration increase damage dealt per second. Their cost is calculated by the following. There are many multiplying factors from skills and items in the game, but for now I’ll ignore them.
Hero Cost
get_hero_cost <- function(base_cost, level){
  base_cost*1.07^level
}
hero_cost_df <- data.frame(gold = get_hero_cost(base_cost = 50, level = 1:10),
level = 1:10)
hero_cost_df %>% ggplot(aes(x = level, y = gold)) +
geom_point() +
scale_y_log10()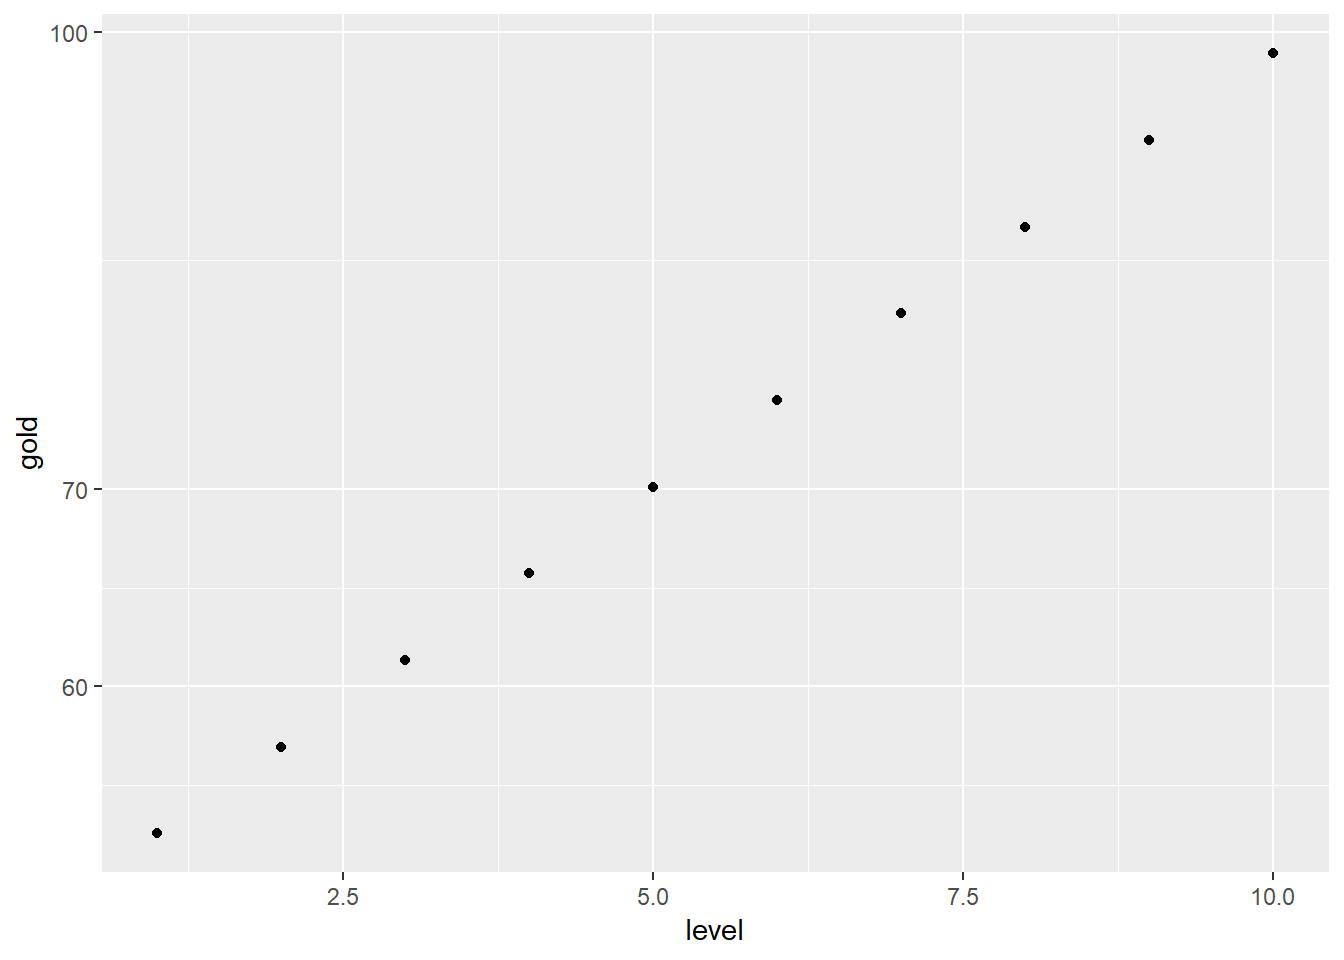
Hero Damage
Hero damage increases linearly with the exception of modifiers, which I’ll be ignoring in this version.
get_hero_damage <- function(base_damage, level, satic_modifier = 1){
  base_damage * level * satic_modifier
}
hero_damage_df <- data.frame(damage = get_hero_damage(base_damage = 5, level = 1:10),
level = 1:10)
hero_damage_df %>% ggplot(aes(x = level, y = damage)) +
geom_point() +
scale_y_log10()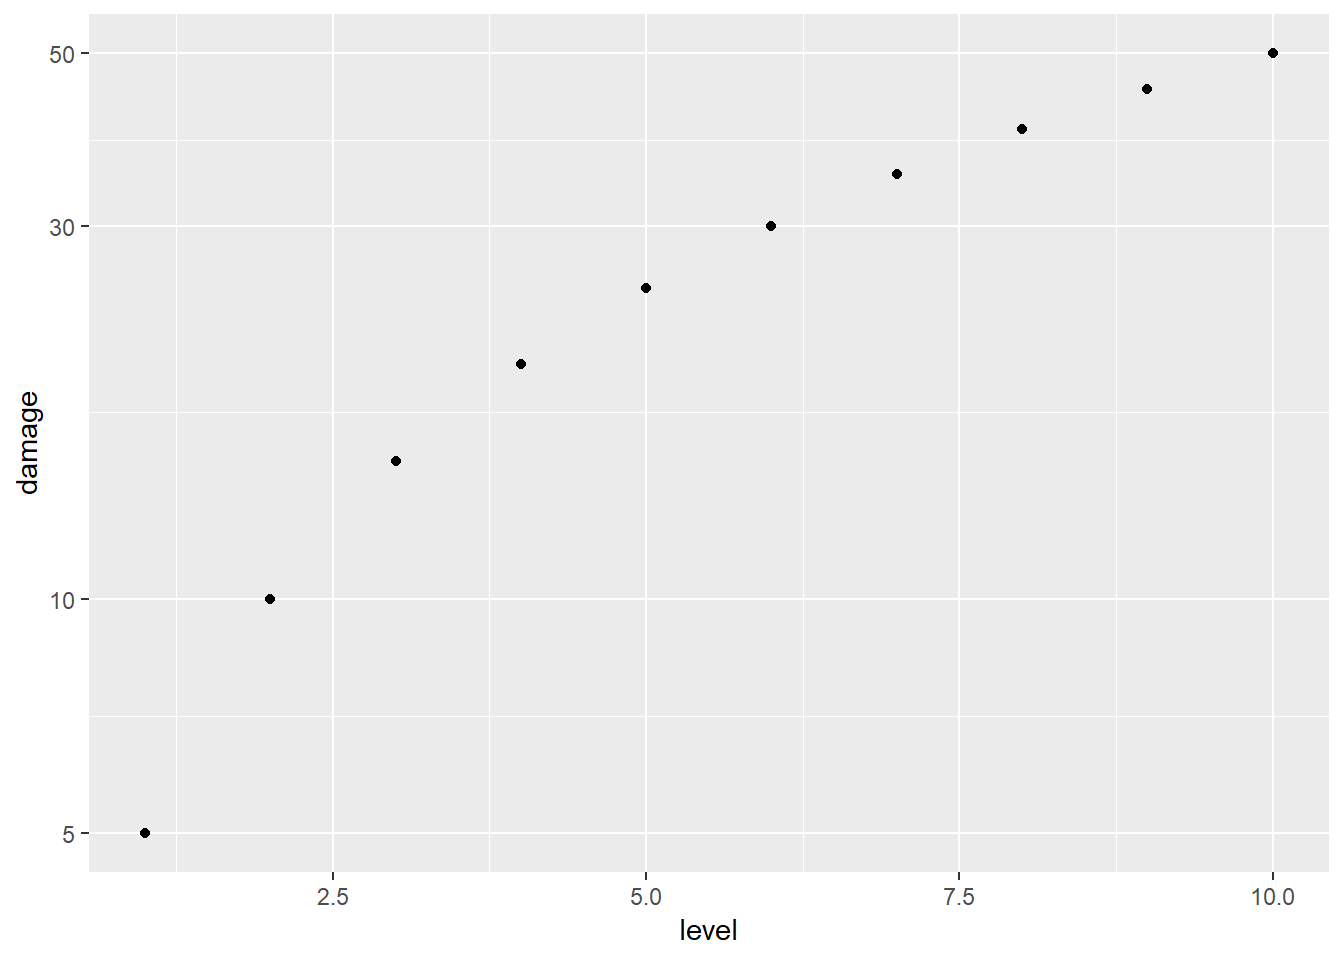
Convert Damage To Gold
Now we need a way to convert damage into amount of gold earning so we can get a measure of how effective buying one hero will be. First I’ll keep things simple by assuming gold rate is constant.
damage_to_gold_aprroximation <- function(dps, zone){
  get_monster_gold(zone)
  gold_per_hp <- get_monster_gold(zone)/get_monster_hp(zone)
  gold_per_damage <- gold_per_hp * dps
  gold_per_damage
}
approximate_gold_df <- data.frame(
gold = damage_to_gold_aprroximation(
dps = 5,
zone = 1:10),
zone = 1:10)
approximate_gold_df %>% ggplot(aes(x = zone, y = zone)) +
geom_point() +
scale_y_log10()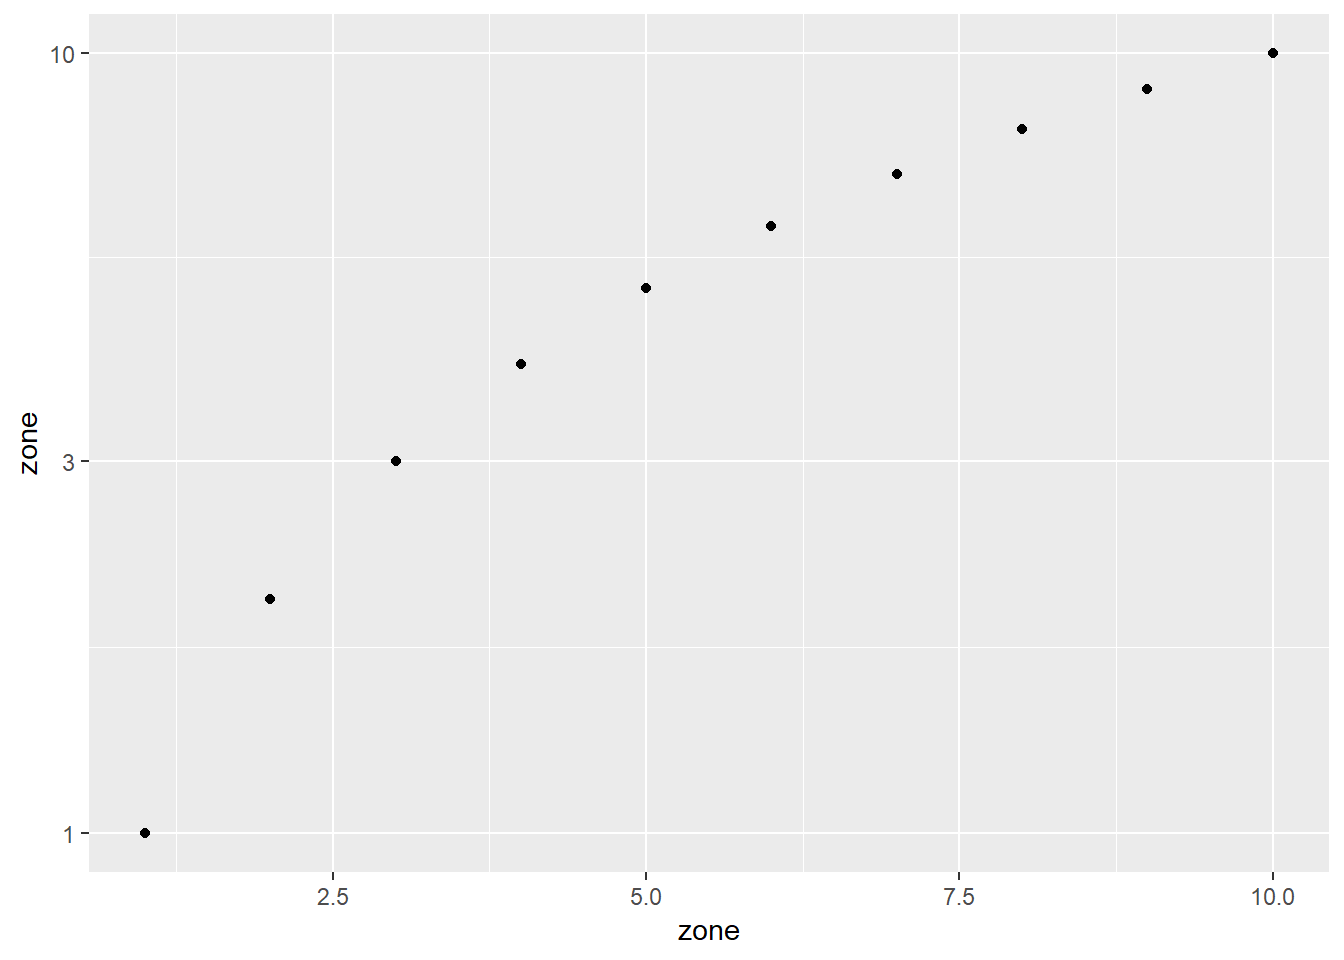
However, there are a lot more factors in getting gold. As time goes on, levels increase and the conversion from dps to gold changes. Here’s how it actually plays out.
- Kill 10 monsters and get their gold
- Increase to next zone
- If next zone is a boss, we need to do enough damage to kill in 30 seconds
- Continue
Additionally, bosses and treasure chests will get more gold and there is a delay between creatures in the same zone.
Boss Health
Bosses will spawn every 5 levels. For this function I am adding - a in order to solve for any return value using the uniroot function.
boss_health <- function(zone, a = 0){
  10 * get_monster_hp(zone) - a
}
boss_health_df <- data.frame(health = boss_health((1:10 * 5)),
zone = (1:10 * 5))
boss_health_df %>% ggplot(aes(x = zone, y = health)) +
geom_point() +
scale_y_log10()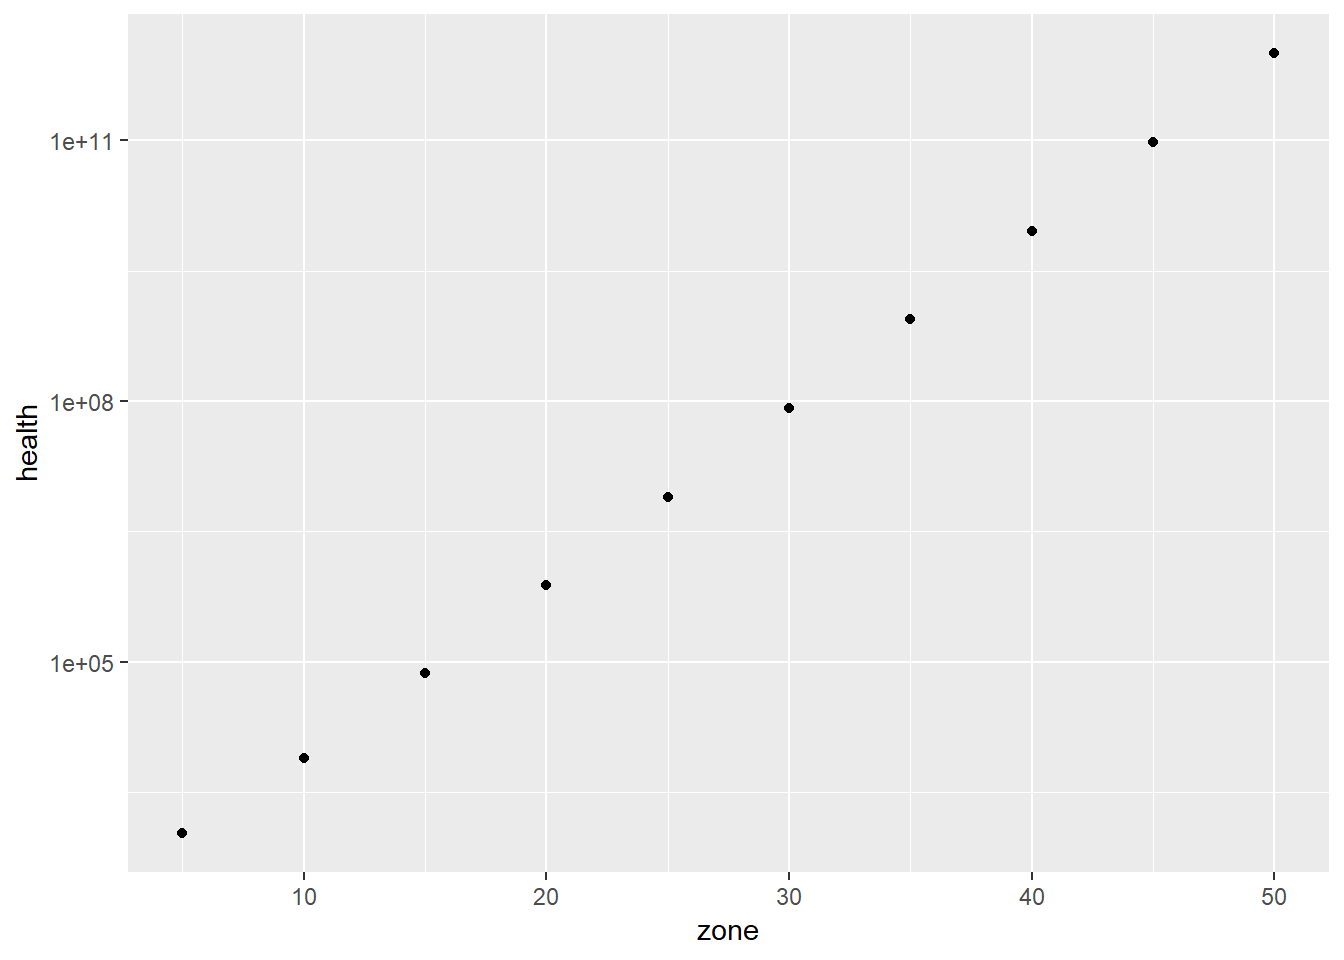
I’m using uniroot to solve boss solve damage for a particular damage per second. E.G F(dps) = 0. Bosses must be beat in 30 seconds or you won’t be able to continue. I’ll be ignoring bubos and chronos for now; these are Clicker Heroes modifiers that happen later in the game.
get_first_unbeatable_boss_zone <- function(dps, bubos=0, chronos=0, upper_limit = 10000){
  damage_per_30_second <-  (dps * (30 + (chronos * 5)))/(1 - (bubos * 0.02))
  damage_health_intercect <- uniroot(boss_health, lower = 0, upper = upper_limit, tol = 0.1, a = damage_per_30_second)
  first_unbeatable_boss_zone <- vapply(damage_health_intercect$root,
                                       function(x)ceiling(x/5)*5, numeric(1))
  first_unbeatable_boss_zone
}
unbeatable_boss_zone_df <- data.frame(
zone = vapply((1:50 * 10), get_first_unbeatable_boss_zone, numeric(1)),
damage = (1:50 * 10))
unbeatable_boss_zone_df %>% ggplot(aes(x = damage, y = zone)) +
geom_point() +
scale_y_log10()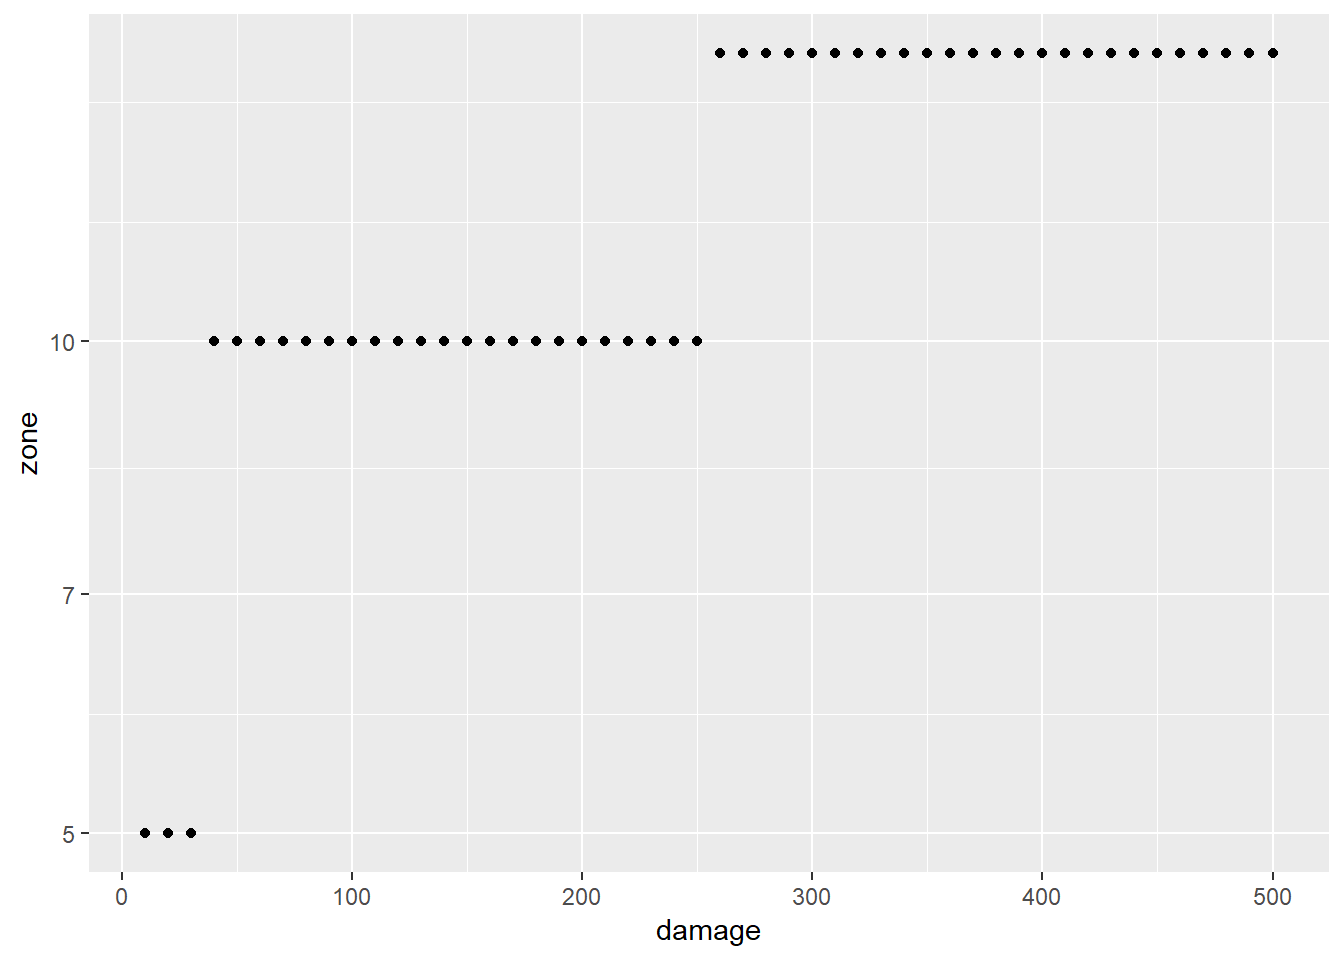
I’ll break down the amount of zones cleared into several functions. time_to_kill is the time it takes to kill a monster (non-boss). The + .5 is because it takes .5 seconds to spawn the next monster.
time_to_kill <- function(dps, zone){
  get_monster_hp(zone) / dps + .5
}
time_to_kill_df <- data.frame(seconds = time_to_kill(dps = 5, zone = 1:10),
zone = (1:10))
time_to_kill_df %>% ggplot(aes(x = zone, y = seconds)) +
geom_point() +
scale_y_log10()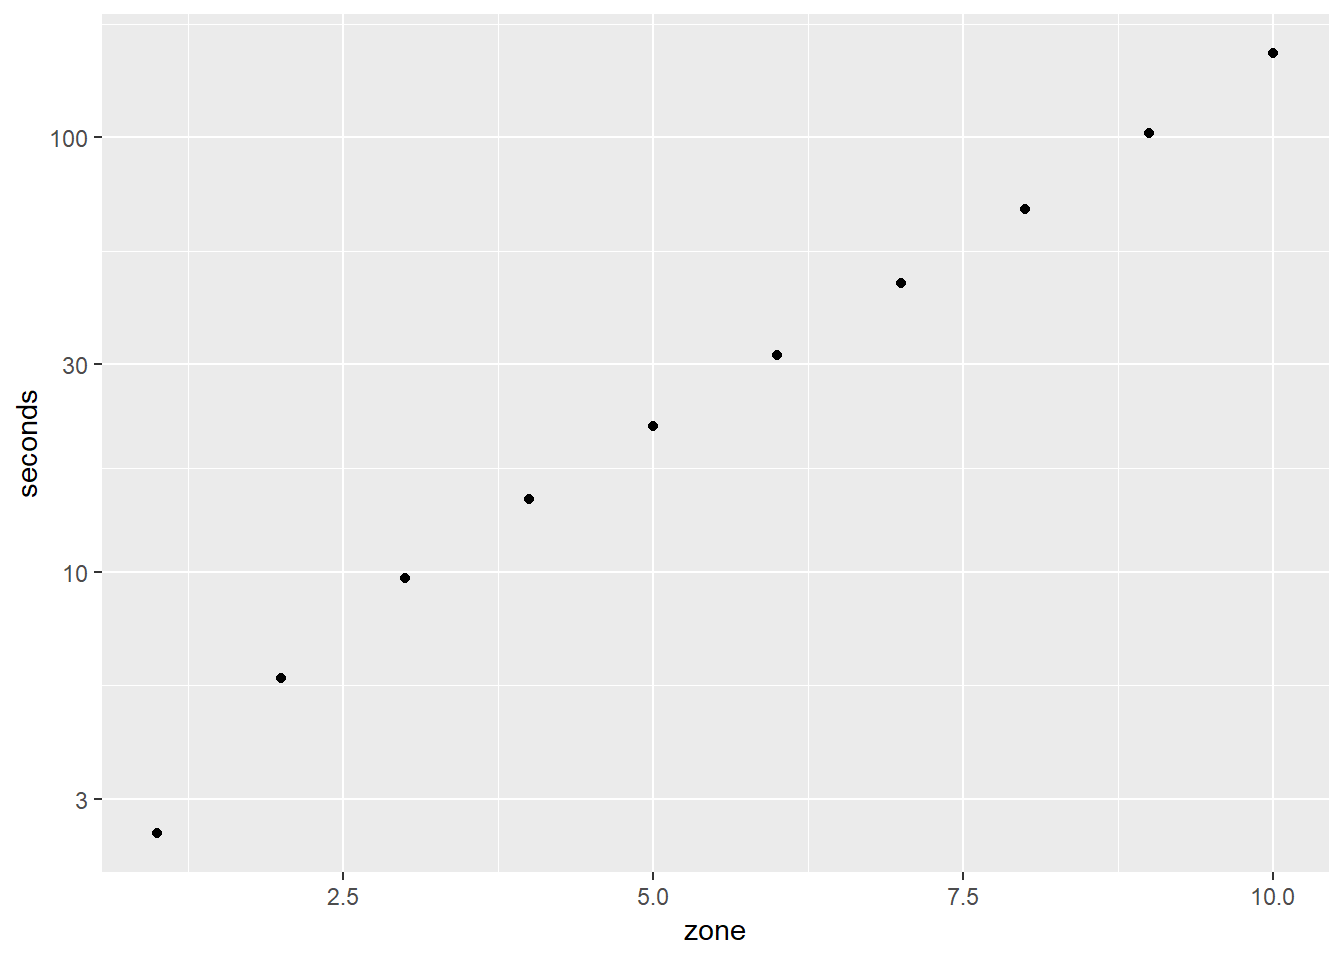
time_to_complete_zone is how long it takes to finish a full zone. By default it takes 10 monster kills to complete a zone.
time_to_complete_zone <- function(dps, zone, monster_kills = 0){
  time_to_kill(dps, zone) * (10 - monster_kills)
}
time_to_complete_zone_df <- data.frame(
seconds = time_to_complete_zone(dps = 5, zone = 1:10),
zone = (1:10))
time_to_complete_zone_df %>% ggplot(aes(x = zone, y = seconds)) +
geom_point() +
scale_y_log10()
zone_to_time use a vector of zones and output how much time it takes take to finish that zone with a static dps. The ifelse statement accounts for difference in boss zones. For now I am ignoring the extra modifiers at this step (bubos and chronos). Without those modifiers, the * 10 health modifier for bosses equals the number of monsters needed to finish zones.
zone_to_time <- function(zone, dps = 10){
  ifelse(zone %% 5 == 0, boss_health(zone)/dps,time_to_complete_zone(dps, zone -1) )
}
zone_to_time_zone_df <- data.frame(
seconds = zone_to_time(dps = 5, zone = 1:10),
zone = (1:10))
time_to_complete_zone_df %>% ggplot(aes(x = zone, y = seconds)) +
geom_point() +
scale_y_log10()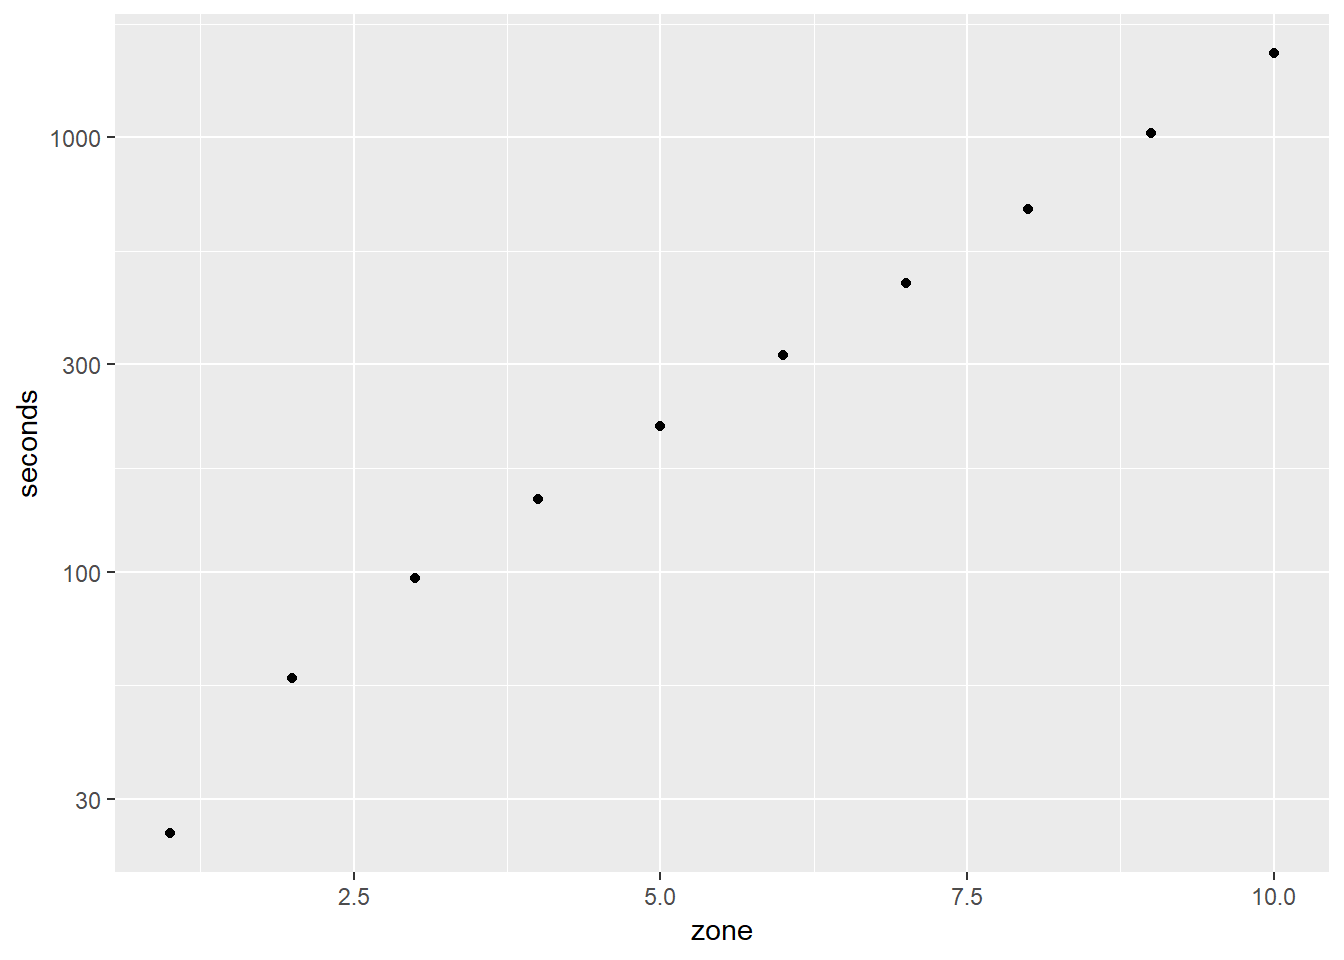
sum_zone_to_time returns the cumulative sum vector of our zone_to_time conversion. The a adjustment will be used to solve for the root with uniroot.
sum_zone_to_time <- function(zone, dps = 10, start_zone = 1, a = 0){
  raw_sum <- cumsum(zone_to_time(zone, dps = dps)) - cumsum(zone_to_time(zone = start_zone, dps = dps)) - a
  raw_sum[is.na(raw_sum)] <- Inf
  raw_sum
}
zone_to_time_zone_df <- data.frame(
seconds = sum_zone_to_time(dps = 5, zone = 1:10),
zone = (1:10))
zone_to_time_zone_df %>% ggplot(aes(x = zone, y = seconds)) +
geom_point() +
scale_y_log10()## Warning: Transformation introduced infinite values in continuous y-axis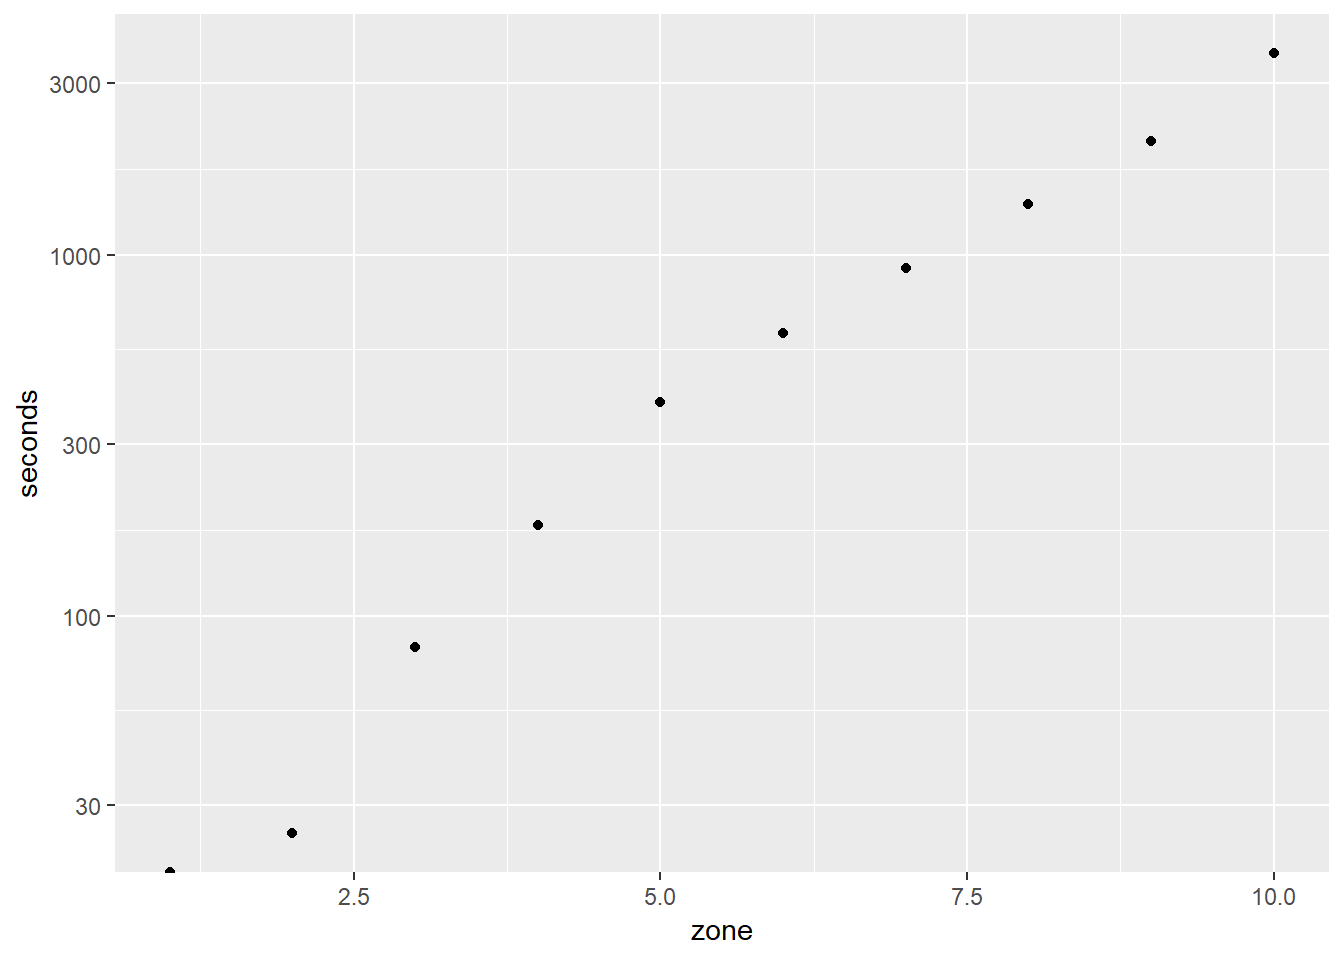
get_max_zone_by_time returns a list with the zone achieved in a certain amount of time and the monsters killed in that zone. Monsters will be in fractions to account for mid-zone purchases.
get_max_zone_by_time <- function(time, dps, start_zone = 1, upper_limit = 10000){

  roots <- suppressWarnings(vapply(time, function(time)uniroot(sum_zone_to_time, lower = 0, upper = upper_limit, tol = 0.01, dps = dps, start_zone = start_zone, a = time)$root, numeric(1)))

  zones <- vapply(roots, floor, numeric(1))
  monsters_killed_in_zone <- (roots - zones) * 10
  list(zone = zones, monster_kills = monsters_killed_in_zone)
}
max_zone_by_time_df <- data.frame(
zone = get_max_zone_by_time(time = (1:10*60), dps = 5)$zone,
minutes = (1:10))
max_zone_by_time_df %>% ggplot(aes(x = minutes, y = zone)) +
geom_point() +
scale_y_log10()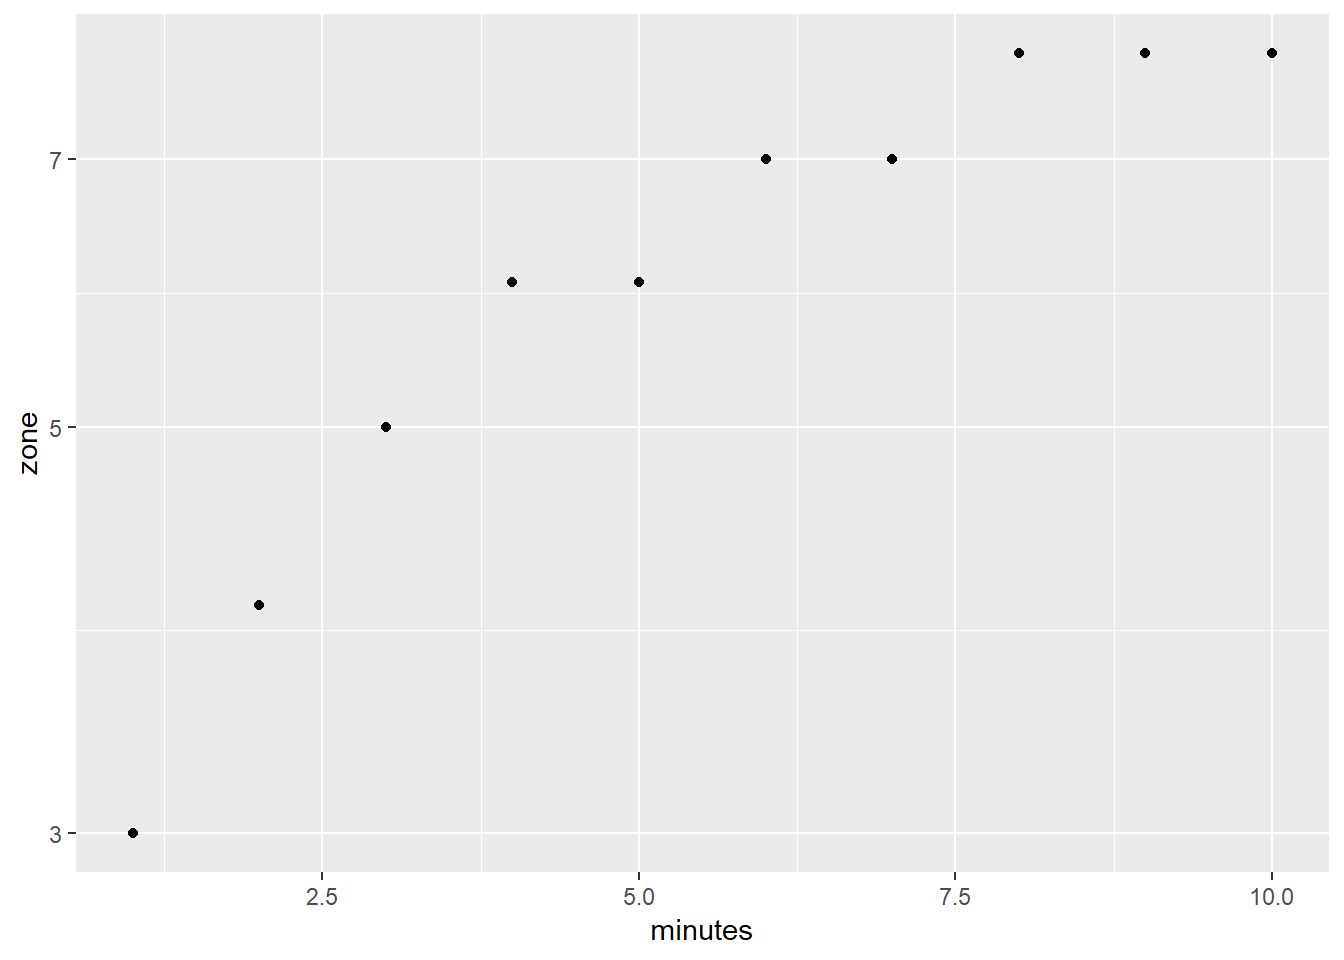
Now I can put all these functions together to compute gold attained. I’m going to use the game’s offline gold function to calculate gold attained. Offline gold is only an approximation of in-game gold; it won’t take into account the increase in rate of gold over levels and only bases the gold received based on the highest zone achievable.
offline_gold <- function(seconds, dps, start_zone = 1, a = 0, gold_bonus_multiplier = 1, treasure_chest_chance = 0.01, treaseure_chest_gold_multiplier = 10, fortuna_level = 0){

  #get max zone attainable by dps on bosses
  highest_zone_from_boss <- get_first_unbeatable_boss_zone(dps) - 1
  #get max zone attainable by time spent
  zone_by_time <- get_max_zone_by_time(time = seconds, dps = dps, start_zone = start_zone)
  highest_zone_from_time <- zone_by_time$zone
  highest_zone_from_time_monsters_killed <- zone_by_time$monster_kills
  monsters_killed <- ifelse(highest_zone_from_time <  highest_zone_from_boss,
                            highest_zone_from_time_monsters_killed,
                            1)

  highest_zone <- pmin(highest_zone_from_time,highest_zone_from_boss)
  monster_hp = get_monster_hp(highest_zone)
  monster_gold = get_monster_gold(highest_zone)
  offline_gold = (seconds/(monster_hp/dps+0.5)) *
    monster_gold*gold_bonus_multiplier *
    (1+treasure_chest_chance *
       (treaseure_chest_gold_multiplier-1)) *
    (1+fortuna_level*0.0225) - a

  offline_gold
}
offline_gold_df <- data.frame(
gold = offline_gold(seconds = (1:10*60), dps = 5),
minutes = (1:10))## Warning in uniroot(boss_health, lower = 0, upper = upper_limit, tol =
## 0.1, : NA/Inf replaced by maximum positive valueoffline_gold_df %>% ggplot(aes(x = minutes, y = gold)) +
geom_point() +
scale_y_log10()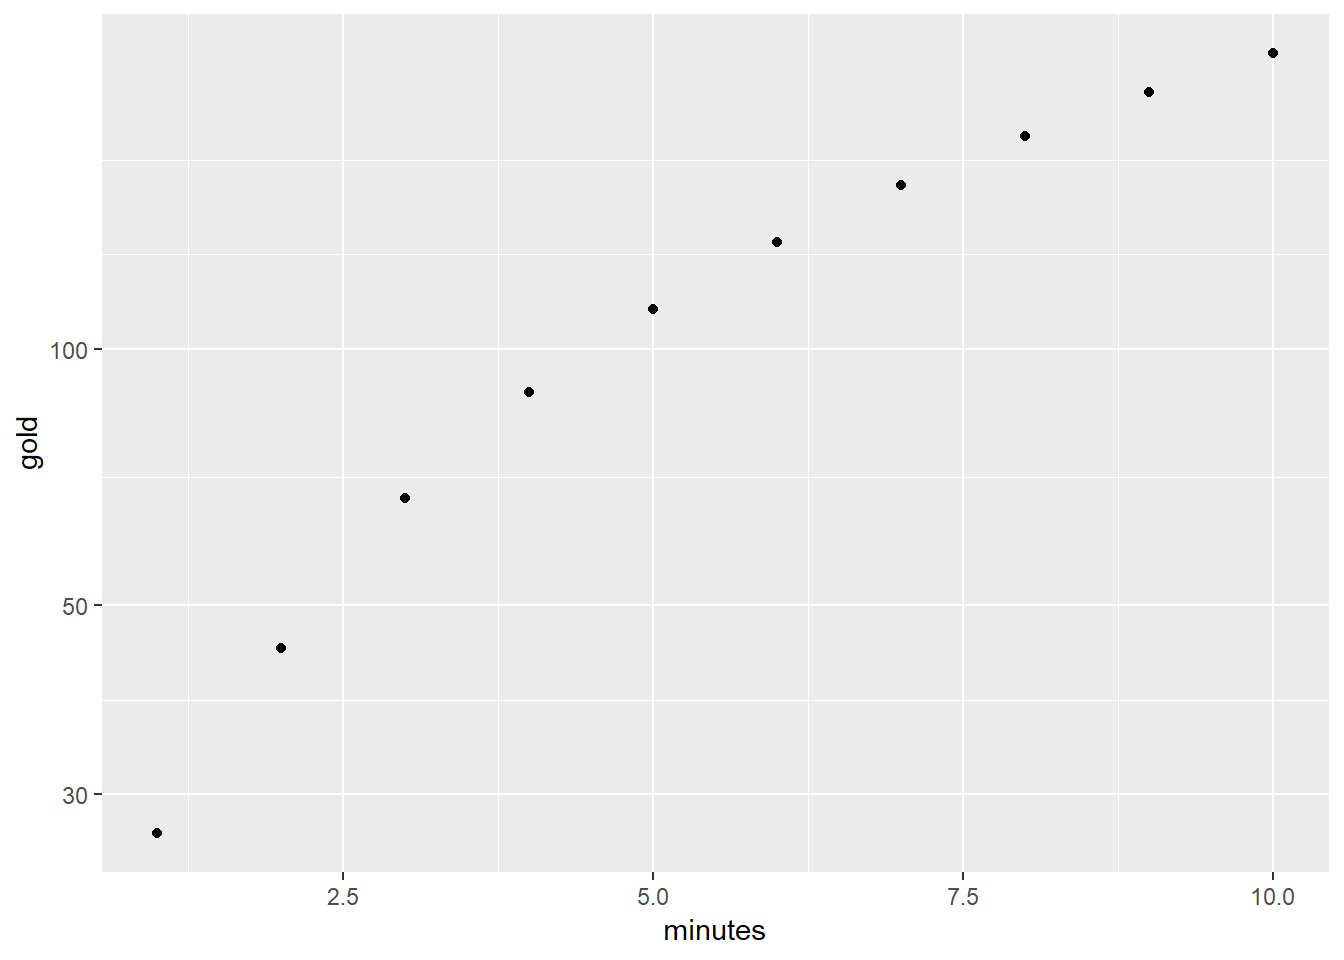
Calculating Optimal Purchase
With our base functions defined we can start to get an idea of what the most optimal purchase is at a given point. Let’s start by importing the heroes. I know I wont get too late in the game with this analysis, so some later heroes are not included. I have also removed Cid, the Helpful Adventurer because she has to be accounted for separately.
hero_costs_df <- read.csv("../data/clicker_heroes_cost.csv", header=FALSE)
names(hero_costs_df) <- c("hero_name", "base_cost", "base_damage")hero_costs_df## hero_name base_cost base_damage
## 1 Treebeast 5.0e+01 5.0000e+00
## 2 Ivan, the Drunken Brawler 2.5e+02 2.2000e+01
## 3 Brittany, Beach Princess 1.0e+03 7.4000e+01
## 4 The Wandering Fisherman 4.0e+03 2.4500e+02
## 5 Betty Clicker 2.0e+04 9.7600e+02
## 6 The Masked Samurai 1.0e+05 3.7250e+03
## 7 Leon 4.0e+05 1.0859e+04
## 8 The Great Forest Seer 2.5e+06 4.7143e+04
## 9 Alexa, Assassin 1.5e+07 1.8690e+05
## 10 Natalia, Ice Apprentice 1.0e+08 7.8200e+05
## 11 Mercedes, Duchess of Blades 8.0e+08 3.7210e+06
## 12 Bobby, Bounty Hunter 6.5e+09 1.7010e+07
## 13 Broyle Lindeoven, Fire Mage 5.0e+10 6.9480e+07
## 14 Sir George II, King's Guard 4.5e+11 4.6070e+08
## 15 King Midas 4.0e+12 3.0170e+09
## 16 Referi Jerator, Ice Wizard 3.6e+13 2.0000e+10
## 17 Abaddon 3.2e+14 1.3100e+11
## 18 Ma Zhu 2.7e+15 8.1470e+11
## 19 Amenhotep 2.4e+16 5.3350e+12
## 20 Beastlord 3.0e+17 4.9140e+13
## 21 Athena, Goddess of War 9.0e+18 1.0860e+15
## 22 Aphrodite, Goddess of Love 3.5e+20 3.1120e+16
## 23 Shinatobe, Wind Deity 1.4e+22 9.1730e+17
## 24 Grant, the General 4.2e+24 2.0270e+20
## 25 Frostleaf 2.1e+27 7.4690e+22
## 26 Dread Knight 1.0e+40 1.3100e+32
## 27 Atlas 1.0e+55 9.6550e+44
## 28 Terra 1.0e+70 7.1130e+57
## 29 Phthalo 1.0e+85 5.2410e+70
## 30 Orntchya Gladeye, Didensy Banana 1.0e+100 3.8610e+83
## 31 Lilin 1.0e+115 2.8450e+96
## 32 Cadmia 1.0e+130 2.0960e+109
## 33 Alabaster 1.0e+145 1.5440e+122
## 34 Astraea 1.0e+160 1.1380e+135
## 35 Chiron 1.0e+175 8.3860e+147
## 36 Moloch 1.0e+190 6.1780e+160
## 37 Bomber Max 1.0e+205 4.5520e+173
## 38 Gog 1.0e+220 3.3540e+186
## 39 Wepwawet 1.0e+235 2.4710e+199Now we calculate time_to_profit for each, then pick the min. This calculation is based off of the spreadsheets made by Anthony Pecorella. It’s not a perfect optimization for all the modifiers that take place in Clicker Heroes, but it will work for now.
simulate_game <- function(total_moves, dps, monster_level, hero_costs_df){
  #establish counts and vector trackers

  #currently only using the first 20 heroes
  hero_tracker <- head(hero_costs_df,20)
  hero_tracker$level <- 0
  time <- 0
  zone <- 1
  monsters_killed <- 1
  #vectors will return all the interesting stats from the simulation
  time_vector <- vector("numeric", total_moves)
  purchase_vector <- vector("numeric", total_moves)
  damage_vector <- vector("numeric", total_moves)
  gold_vector <- vector("numeric", total_moves)
  zone_vector <- vector("numeric", total_moves)
  monsters_killed_vector <- vector("numeric", total_moves)

  #appending this dataframe with all heroes purchased
  heroes_purchased_df <- data.frame(time = c(), level = c(), name = c())

  for(i in 1:total_moves){
    #If error return infinity
    hero_costs <- get_hero_cost(hero_tracker$base_cost, hero_tracker$level)
    times_to_purchase <- suppressWarnings(
      vapply(hero_costs,
             function(gold)tryCatch(
               uniroot(offline_gold,
                       lower = 0,
                       upper = 10000,
                       tol = 0.01,
                       dps = dps,
                       start_zone = zone,
                       start_monsters_killed = monsters_killed,
                       a = gold)$root,
               error=function(e) Inf),
             numeric(1)))

    #get starting monster_level and kills for next loop
    offline_gold_stats <- suppressWarnings(
      get_offline_gold_stats(
        seconds = times_to_purchase,
        dps = dps,
        start_zone = zone,
        start_monsters_killed = monsters_killed))

    #vector of indices to loop through
    hero_indices <- 1:length(times_to_purchase)

    #run offline_gold intersect with cost at newly adjusted dps
    times_to_value <- suppressWarnings(
      vapply(
        hero_indices,
        function(j)tryCatch(
          uniroot(offline_gold,
                  lower = 1,
                  upper = 1000000,
                  tol = 0.01,
                  dps = hero_tracker$base_damage[j] + dps,
                  start_zone = zone,
                  start_monsters_killed = monsters_killed,
                  a = hero_costs[j])$root,
          error=function(e) Inf), numeric(1)))

    #time to profit will be our measure for best choice
    times_to_profit <- times_to_purchase + times_to_value

    best_purchase <- which.min(times_to_profit)

    #increment all the values for the next loop
    zone <- offline_gold_stats$highest_zone[best_purchase]
    monsters_killed <- offline_gold_stats$monsters_killed[best_purchase]
    time <- time + times_to_purchase[best_purchase]
    dps <- dps + hero_tracker$base_damage[best_purchase]
    hero_tracker[best_purchase,]$level <- hero_tracker[best_purchase,]$level + 1

    time_vector[i] <- time
    purchase_vector[i] <-  hero_tracker$hero_name[best_purchase]
    damage_vector[i] <- dps
    zone_vector[i] <-  zone
    monsters_killed_vector[i] <- monsters_killed
    gold_vector[i] <- offline_gold(seconds = 1,
                                   dps = dps)
    time_df <- data.frame(time = time,
                          level = hero_tracker$level,
                          name = hero_tracker$hero_name)
    heroes_purchased_df <- rbind(heroes_purchased_df, time_df)
  }
  stats_df <- data.frame(
    time = time_vector,
    dps = damage_vector,
    zone = zone_vector,
    monsters_killed = monsters_killed_vector,
    gold = gold_vector,
    hero = purchase_vector
  )
  list(heroes_purchased_df = heroes_purchased_df, stats_df = stats_df)
}
Finally, it’s time to test out this first version of the simulation.
simulation_data <- suppressWarnings(simulate_game(100, 1, 1, hero_costs_df))
heroes_purchased_df <-  simulation_data$heroes_purchased_df
stats_df <- simulation_data$stats_df
We can look at the heroes purchased over time. It looks like it follows a log curve as expected.
heroes_purchased_df %>%
  group_by(time) %>%
  mutate(percent = level/sum(level)) %>%
  ggplot(aes(x = time, y = percent, fill = name)) +
  geom_area()
## Warning: package 'bindrcpp' was built under R version 3.4.4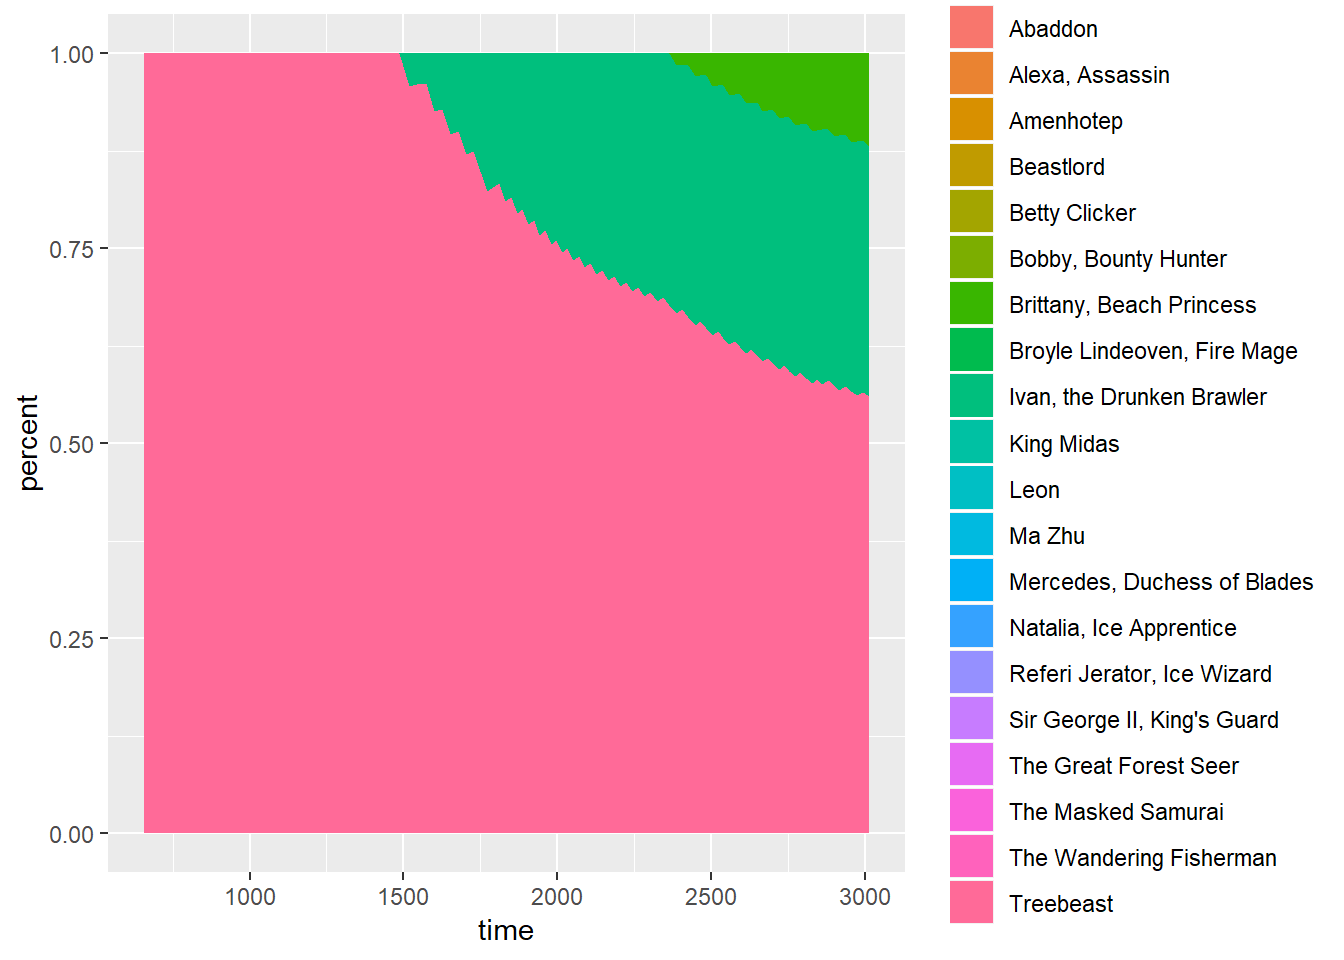
Now to take a look at gold per second over time. It has an interesting step looking function at each purchase.
stats_df %>%
  ggplot(aes(x = time, y = gold)) +
  geom_line()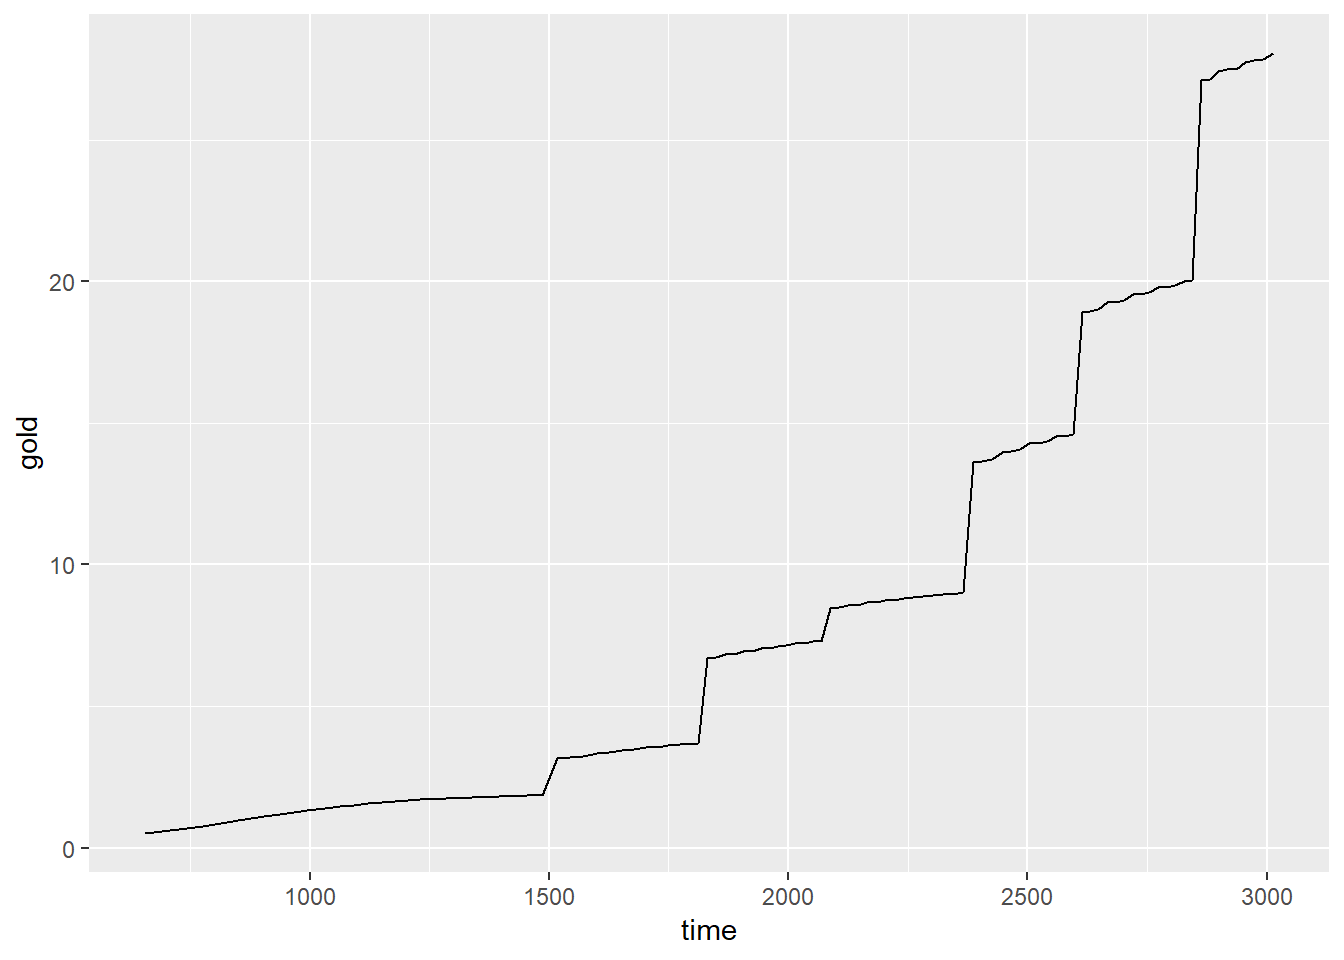
stats_df %>%
  mutate(adjusted_zone = zone + monsters_killed/10) %>%
  ggplot(aes(x = time, y = adjusted_zone)) +
  geom_line()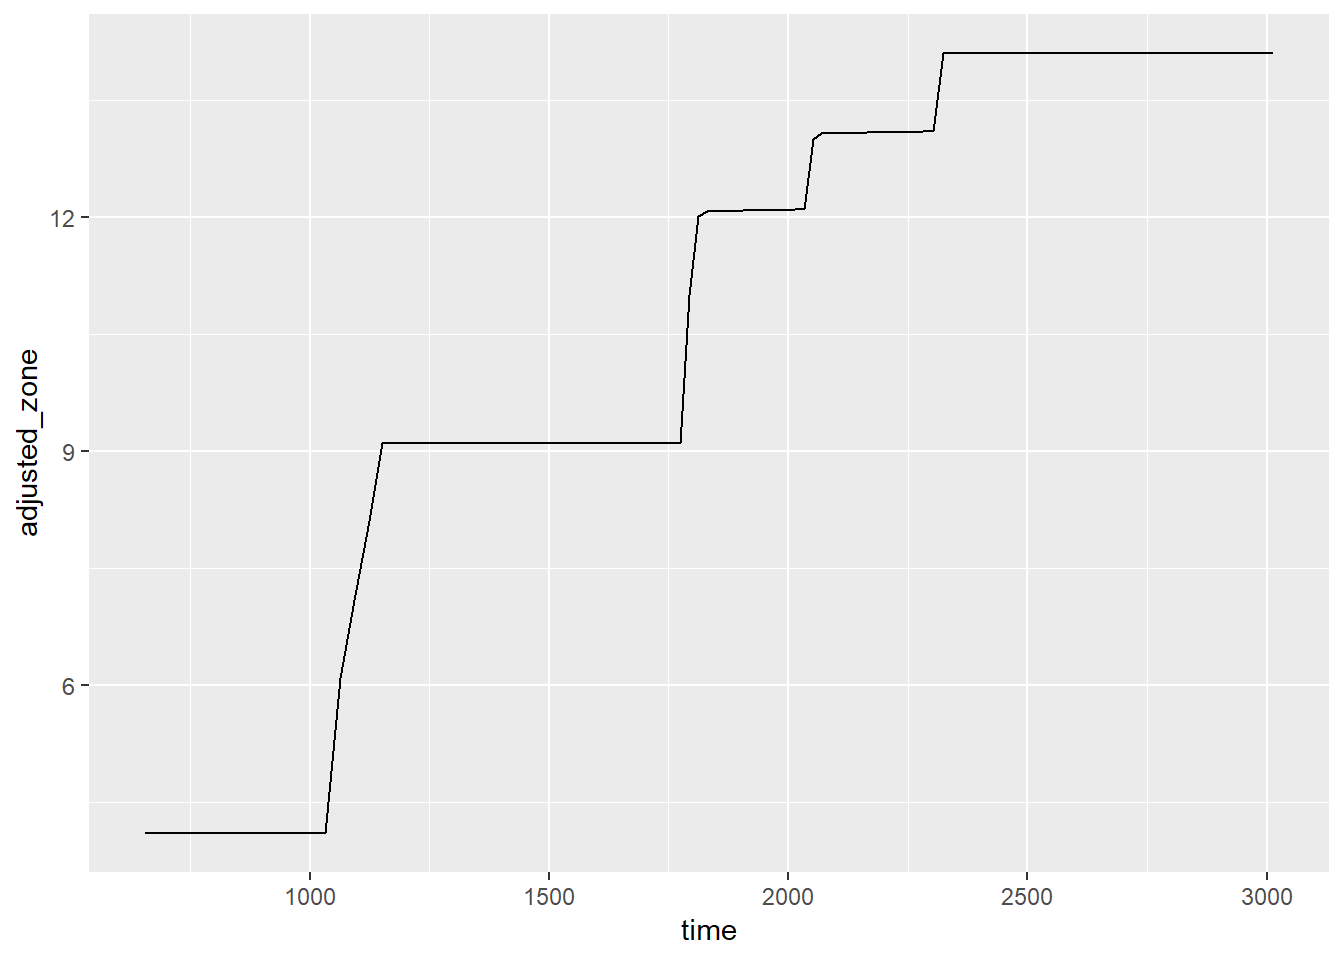
Now let’s look at the damage over time.
stats_df %>%
  ggplot(aes(x = time, y = dps)) +
  geom_line()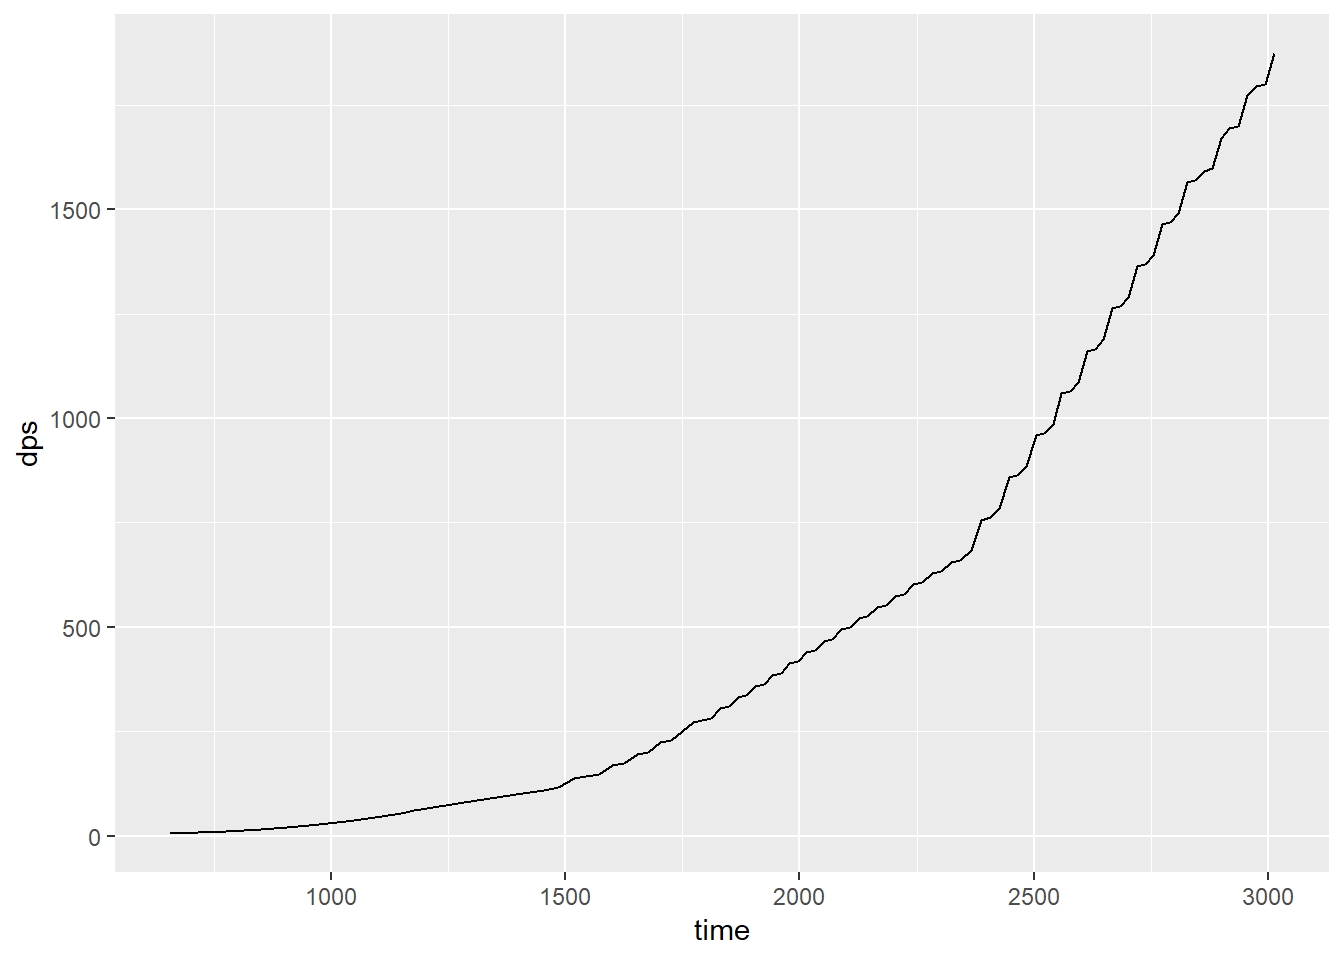
There’s still a lot more variables to explore. I’m curious how more mechanics will affect the optimal decision so I plan to continue to work on this simulation.